

Presenting Al Gore’s An Inconvenient Truth

Project background

Al Gore arrived at Duarte with mountains of research and a compelling, vital message for the world. He left with a keynote presentation fit for the silver screen. Gore’s vision was captured in presentation form and subsequently inspired his Academy Award-winning film, An Inconvenient Truth.

Industry

Services

The big challenge

An irresistible keynote

Please accept marketing-cookies to view this video.

A sample of slides created

1 / 10 5
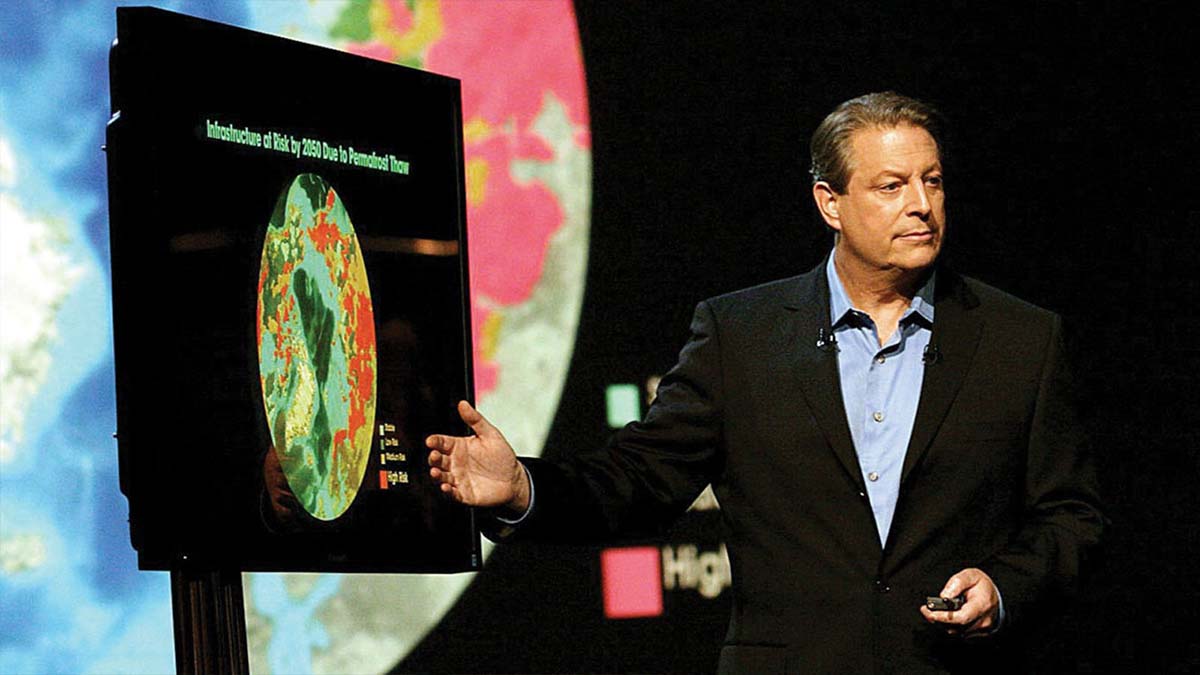
Man in dark blazer and light blue shirt gestures toward a display screen showing a circular heat map titled "Atmospheric CO2 Risk by 2050 has to Personalized Threat" with green and red colored data visualization during a presentation.
"An Inconvenient Truth: A Global Warning" movie poster with tagline "by far the most terrifying film you will ever see" above industrial smokestacks emitting a massive spiral of smoke shaped like a hurricane against a dark stormy sky, with "now playing in select theaters" at bottom.
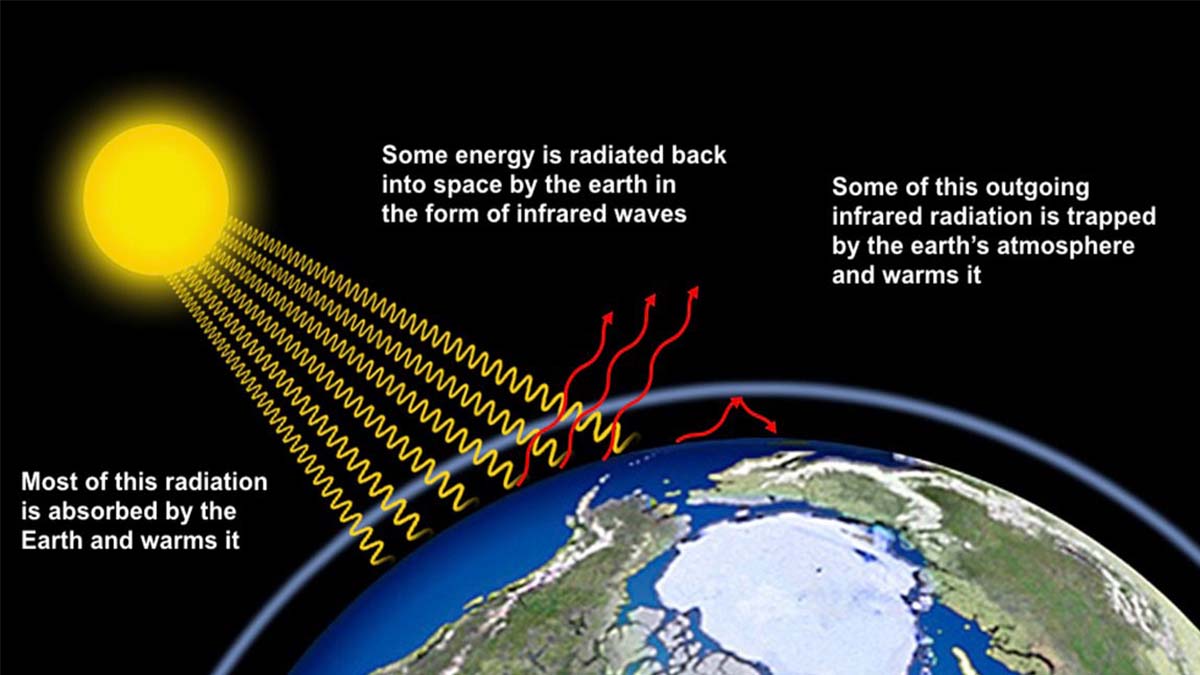
Diagram of the greenhouse effect showing the sun's radiation reaching Earth, most being absorbed and warming the planet, and some infrared radiation being trapped by the atmosphere and warming it further.
Stacked area chart from 1940 to 2010 showing predicted natural variability in blue, expected human-caused variation in green, and actual observed temperatures in red, demonstrating increasing human impact on global temperatures.
Map showing global fisheries status in 1951, color-coded by pre-peak, harvest peak, and post-peak exploitation phases.
The mountain pine beetle, whose population has exploded with the warming climate, is killing more trees than wildfires or logging. Washington Post, March 1, 2006. White line drawing of a mountain pine beetle on black background.
Diagram titled "Vectors for Emerging Infectious Diseases" showing nine red circular icons with white silhouettes representing disease vectors: algae, mosquitoes, tsetse flies, lice, rodents, ticks, bats, fleas, and snails.
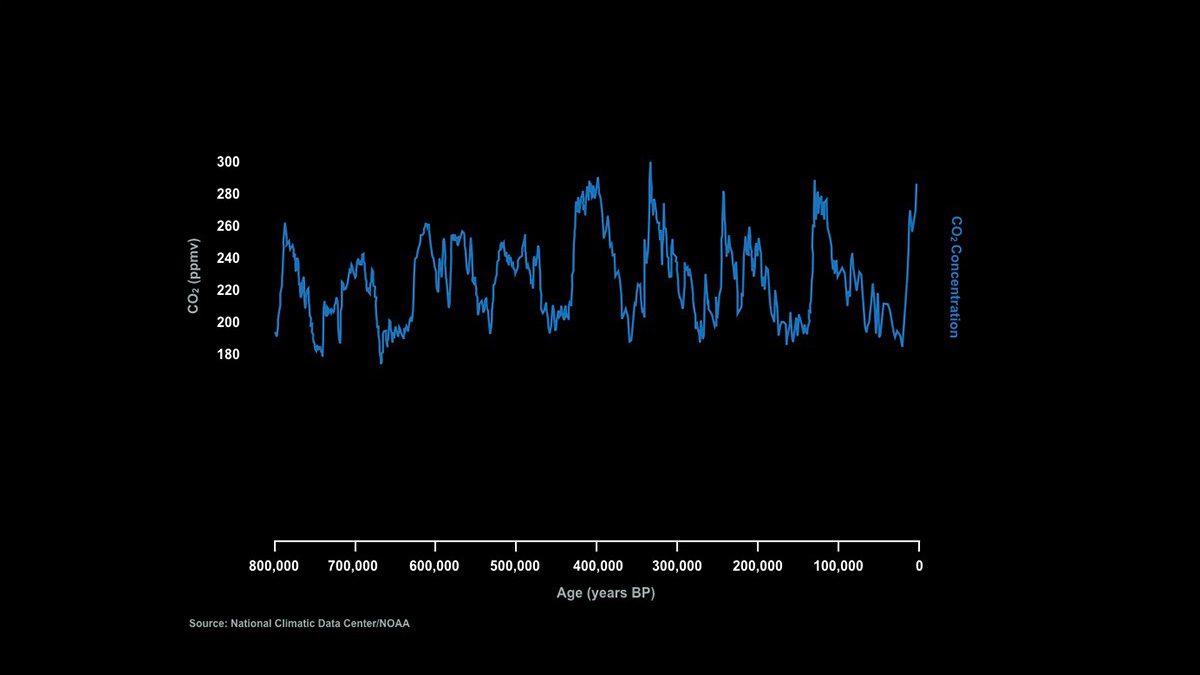
Graph of atmospheric CO2 concentration fluctuating between 180-300 ppmv over 800,000 years before present, sourced from NOAA.
Stacked area chart showing renewable energy production from 1990 to 2030, with biomass, solar, wind, hydro, and geothermal energy sources increasing from approximately 7% to 22% of total energy production.
A Century of Weather-Related Disasters stacked area chart showing the United States in red and the rest of the world in gold, with disasters increasing dramatically over time to reach 50 events.
Man in dark blazer and light blue shirt gestures toward a display screen showing a circular heat map titled "Atmospheric CO2 Risk by 2050 has to Personalized Threat" with green and red colored data visualization during a presentation.
"An Inconvenient Truth: A Global Warning" movie poster with tagline "by far the most terrifying film you will ever see" above industrial smokestacks emitting a massive spiral of smoke shaped like a hurricane against a dark stormy sky, with "now playing in select theaters" at bottom.
Diagram of the greenhouse effect showing the sun's radiation reaching Earth, most being absorbed and warming the planet, and some infrared radiation being trapped by the atmosphere and warming it further.
Stacked area chart from 1940 to 2010 showing predicted natural variability in blue, expected human-caused variation in green, and actual observed temperatures in red, demonstrating increasing human impact on global temperatures.
Map showing global fisheries status in 1951, color-coded by pre-peak, harvest peak, and post-peak exploitation phases.
The mountain pine beetle, whose population has exploded with the warming climate, is killing more trees than wildfires or logging. Washington Post, March 1, 2006. White line drawing of a mountain pine beetle on black background.
Diagram titled "Vectors for Emerging Infectious Diseases" showing nine red circular icons with white silhouettes representing disease vectors: algae, mosquitoes, tsetse flies, lice, rodents, ticks, bats, fleas, and snails.
Graph of atmospheric CO2 concentration fluctuating between 180-300 ppmv over 800,000 years before present, sourced from NOAA.
Stacked area chart showing renewable energy production from 1990 to 2030, with biomass, solar, wind, hydro, and geothermal energy sources increasing from approximately 7% to 22% of total energy production.
A Century of Weather-Related Disasters stacked area chart showing the United States in red and the rest of the world in gold, with disasters increasing dramatically over time to reach 50 events.

Tailoring the message

As Mr. Gore traveled the world, Duarte was charged with supplementing his core presentation with localized content for regional audiences. To raise awareness of climate change, it was necessary to present the evidence on both the global stage and in people’s backyard.

Our process

The Duarte team pored over research papers for compelling and current data evidence and scoured photo archives for disturbing images of climate change. We took raw data and shaped it into captivating charts, infographics, and stat shows. And we never stopped at one option—we’d present several variations to Mr. Gore and decide together which version would move people the most.

Our insights

Mr. Gore was persuading the world and going after the unaware and the unconvinced. He tailored the talk each time he gave it and constantly adapted to the various audiences including politicians, academics, and religious communities. A subtle word change here, a new photo there—each talk was modified for maximum impact. He met his toughest critics head-on with the latest data and indisputable scientific evidence.

Our approach

One of the most important moments for Mr. Gore was when he took his message to the Oprah show. Along with doing the traditional interview, he would give an abbreviated version of his presentation. The production had to be perfect. Being keynote experts, we went onsite to make sure the slides looked fantastic, and that no hiccups occurred.

The results

How we changed the world

The slides he presented informed the film An Inconvenient Truth. The film was seen by millions of people and went on to win an Oscar. The film has been credited for raising international public awareness of global warming and re-energizing the environmental movement.

1000 1000 +

Slide show presentations

The film, An Inconvenient Truth, features the slide show which Al Gore has presented over 1,000 times to audiences worldwide.

1 1

Oscar-winning film

Our presentation slides informed the Academy Award-winning film, An Inconvenient Truth.

1 1 M

Unique viewers

The film based off of the slide show has been seen by millions and brought life back to the environmental movement.