Guides and tools
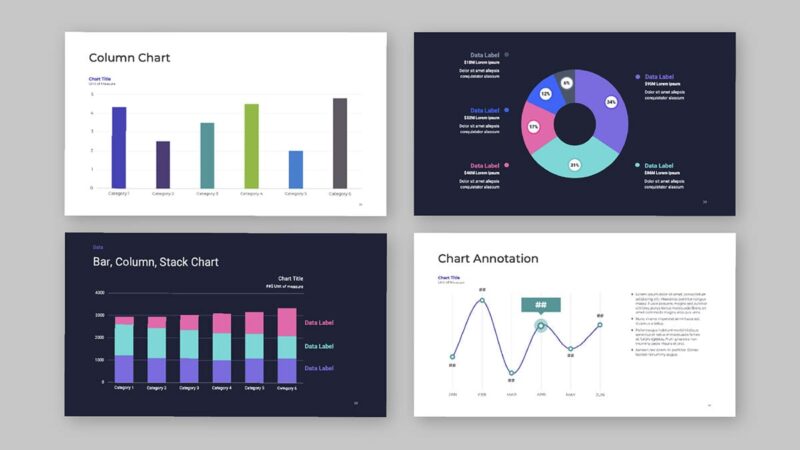
Chart annotation toolkit
View expert examples and learn methods for overlaying visual annotations onto a chart.
Clever animated examples of charts that reveal data over time, for you to download and deconstruct.

In this guide you’ll find examples of data that is revealed over time. We created this file to showcase several alternative and creative ways to display data. As you continue to understand the importance of communicating data effectively, at times you may be compelled to present your insights with a more creative impact and cadence. We hope these samples inspire new creative approaches.
You’ll learn how to: